VLM Land Monitoring Platform
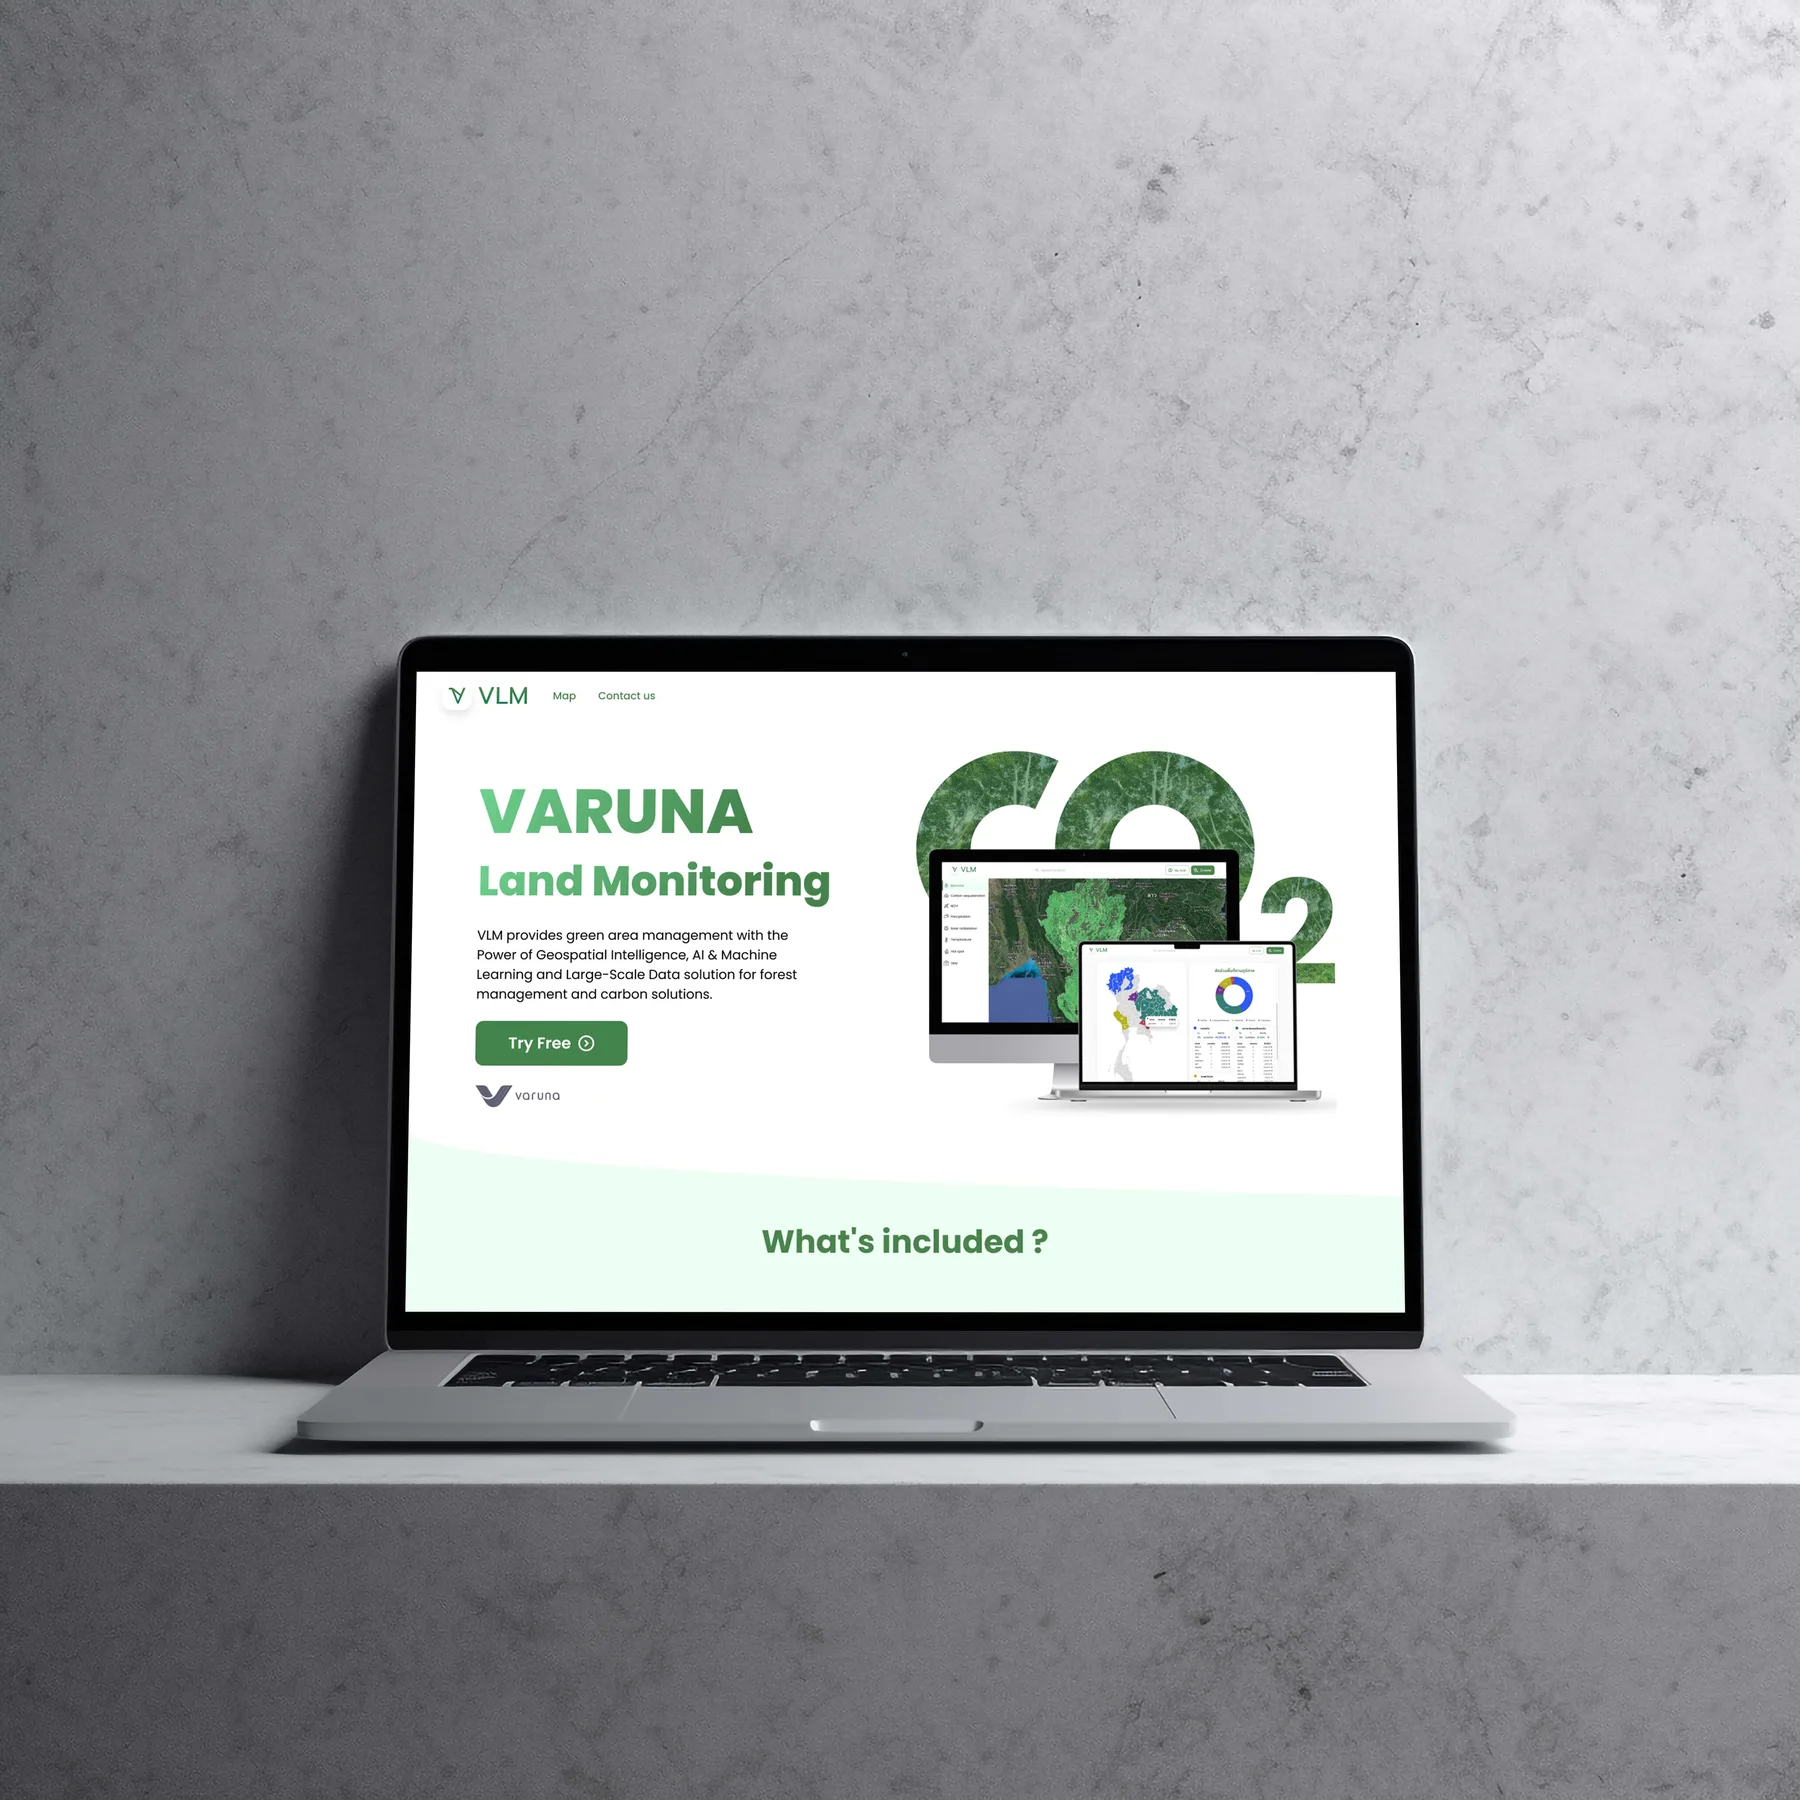
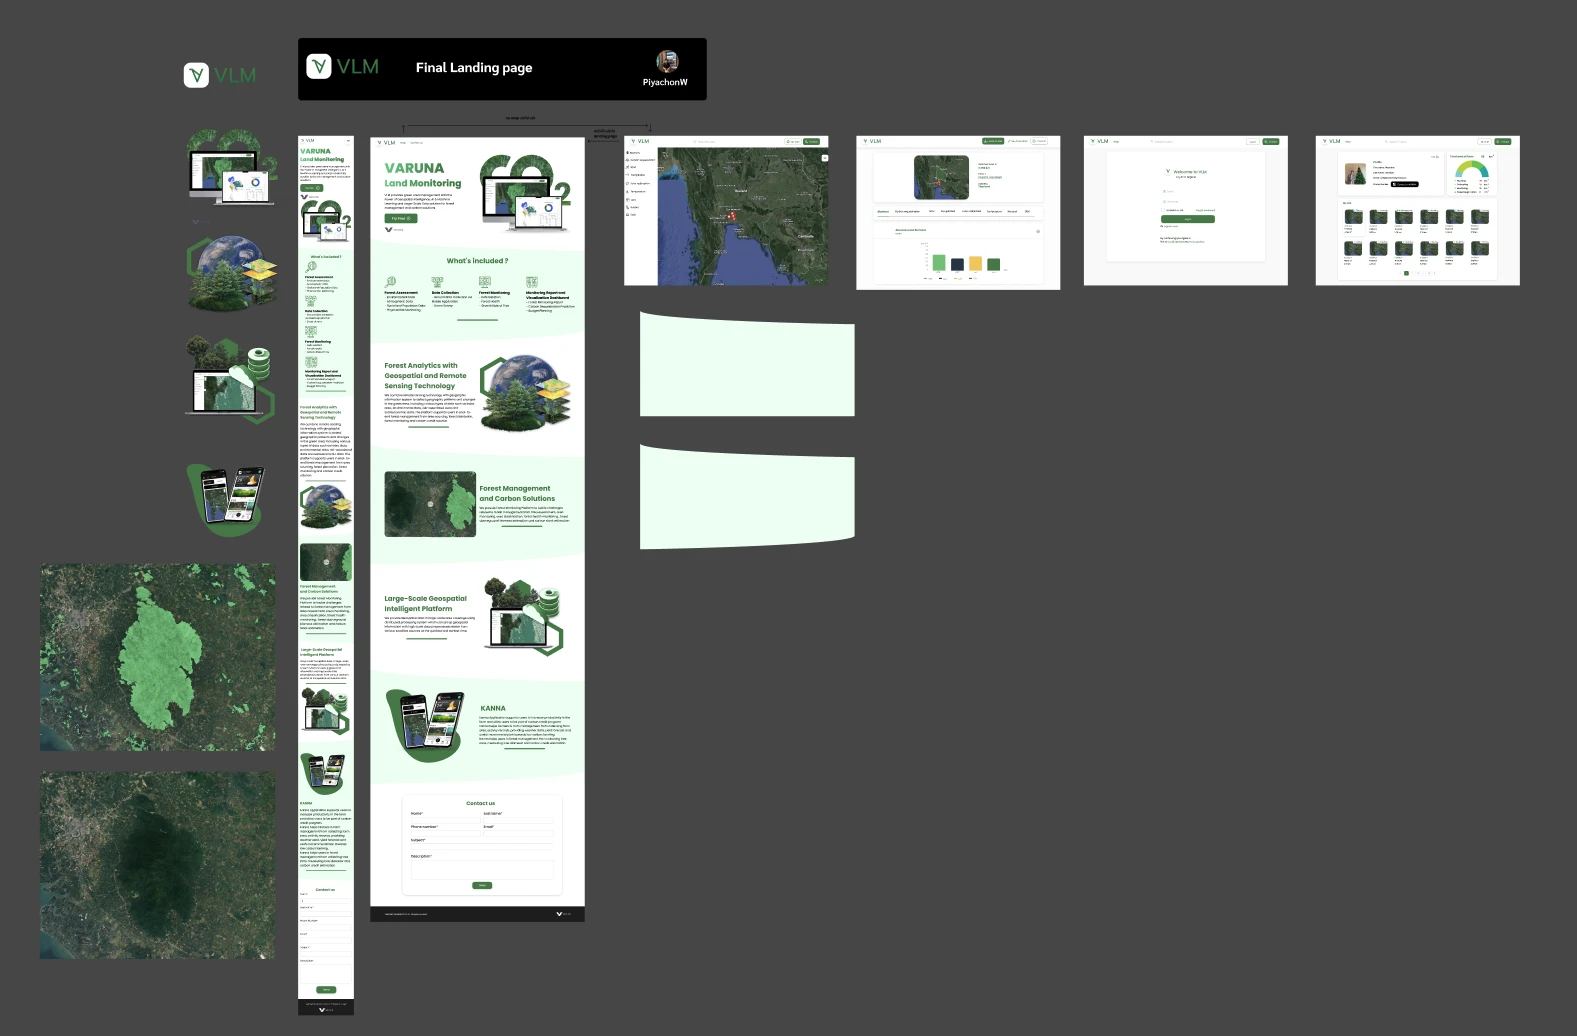
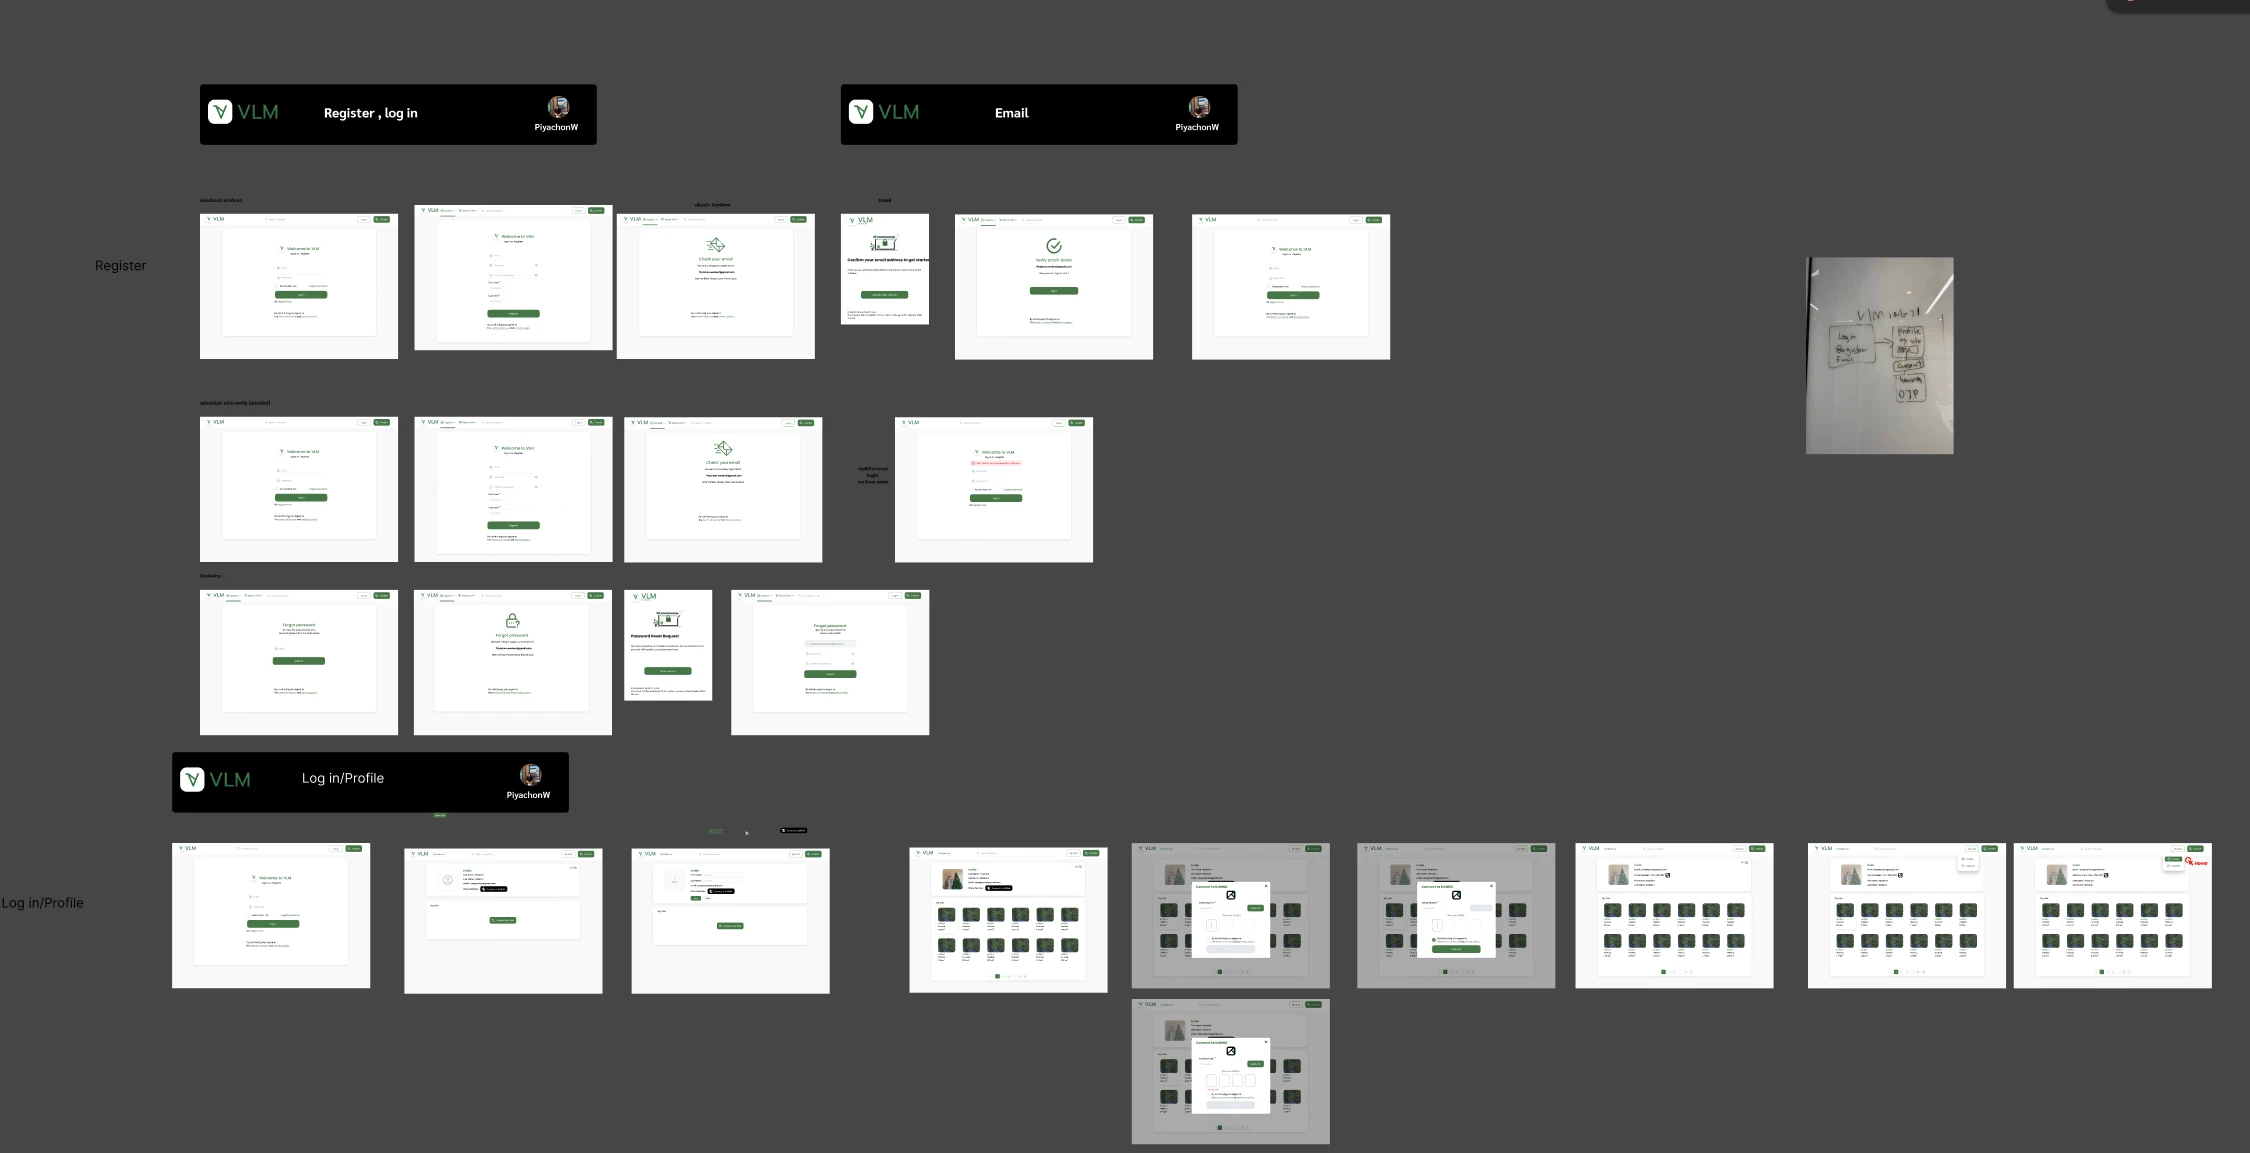
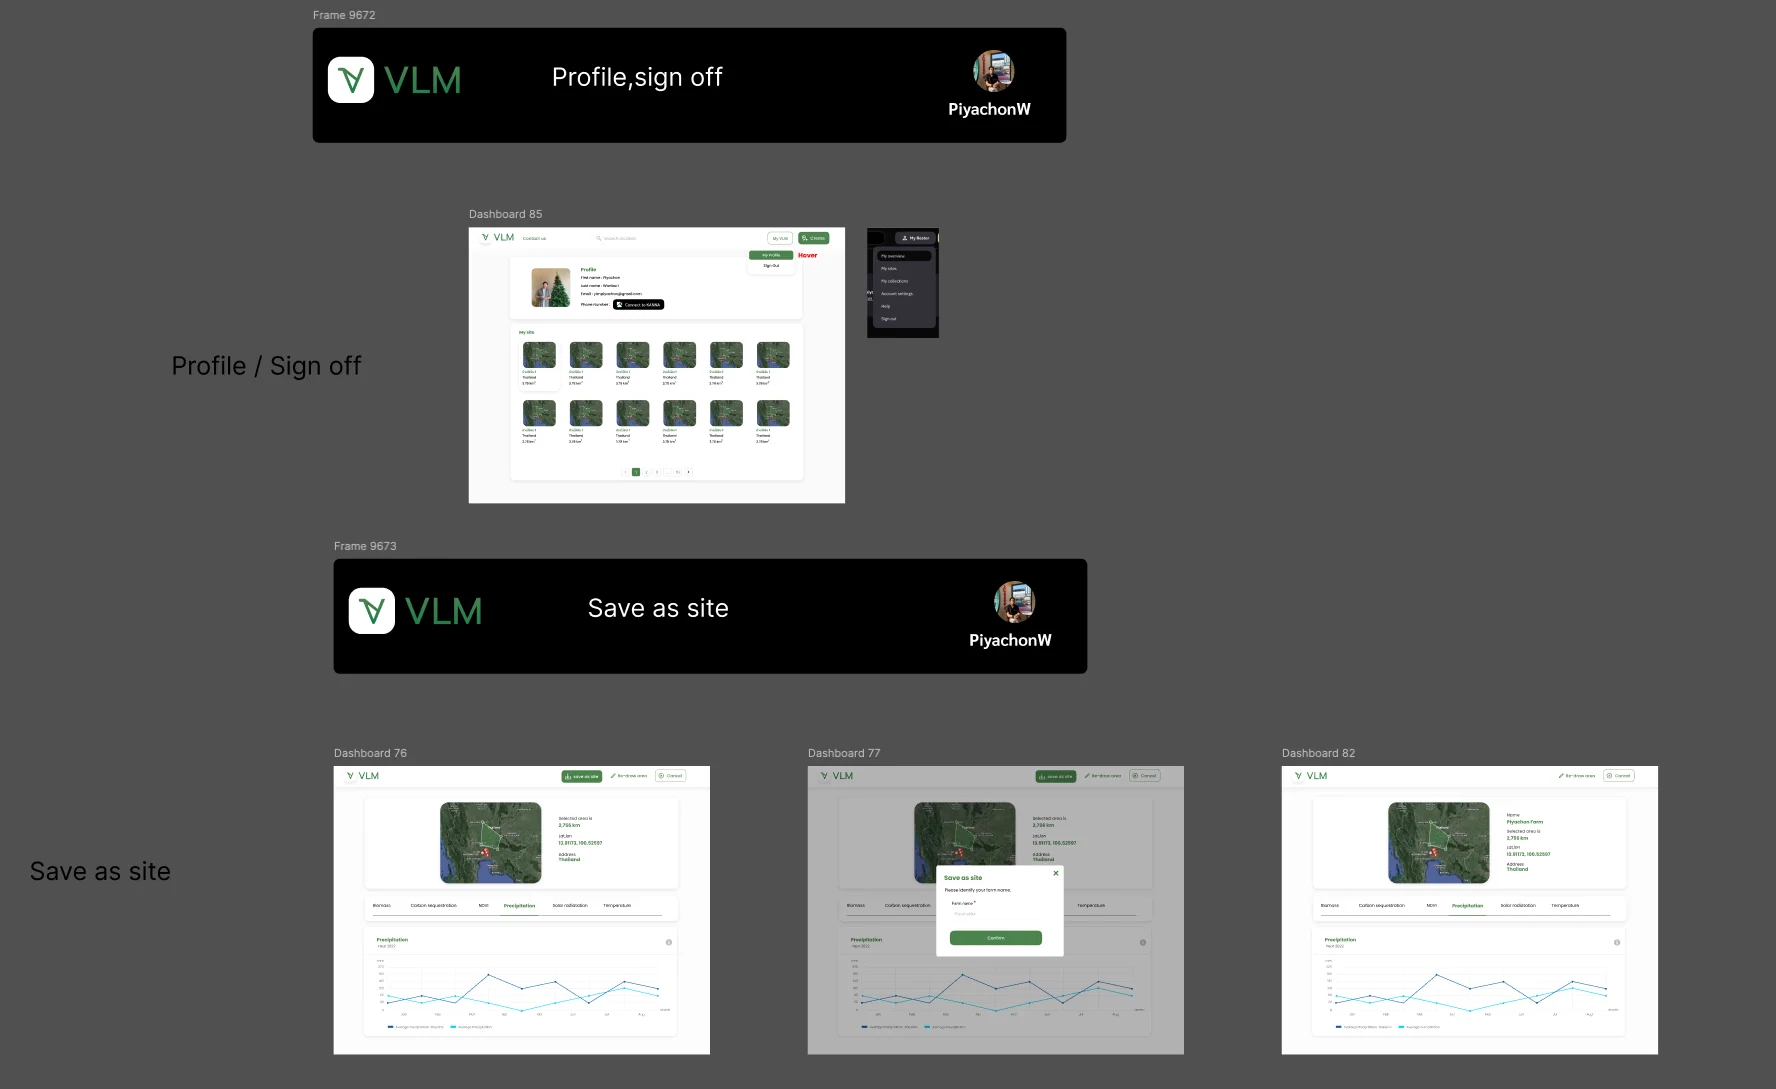
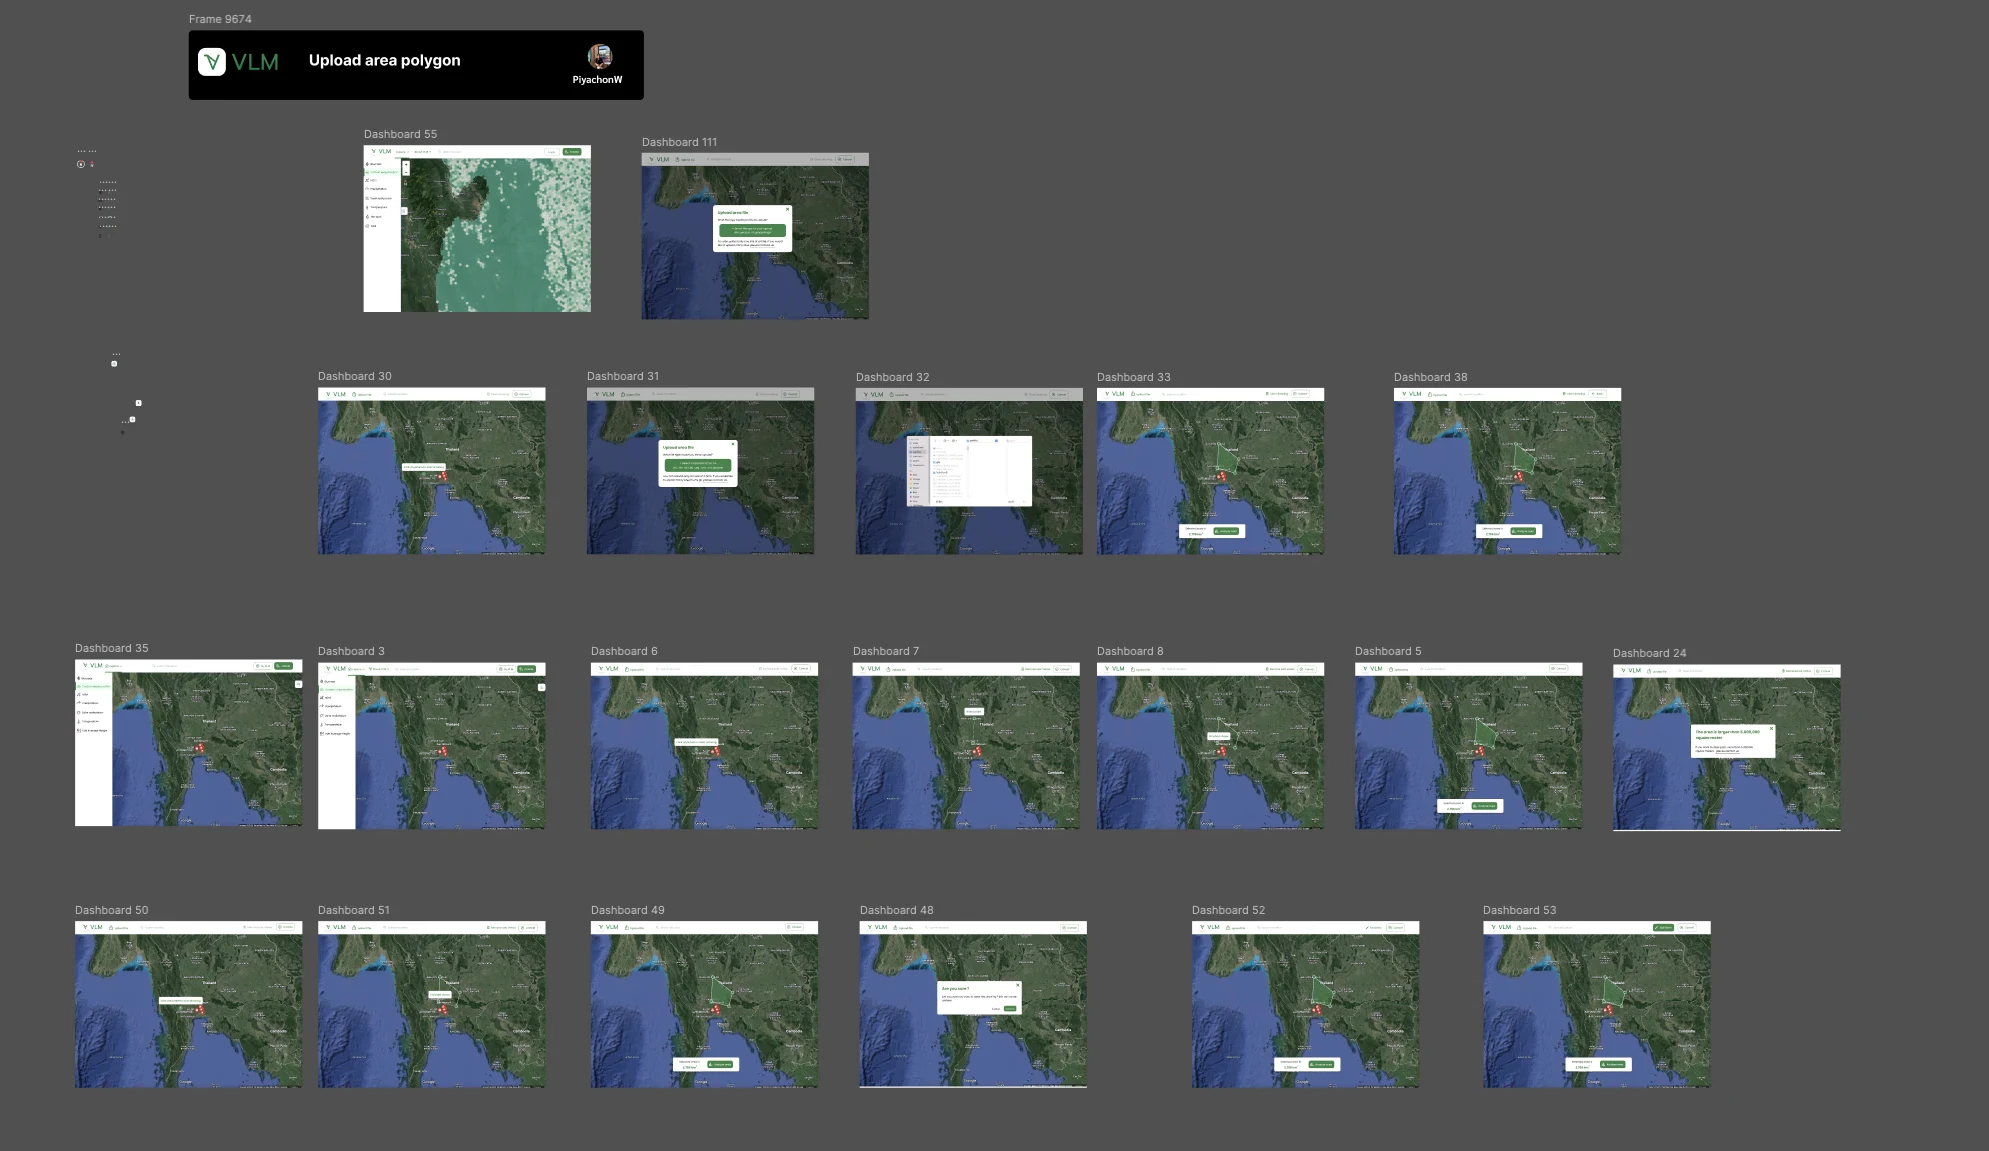
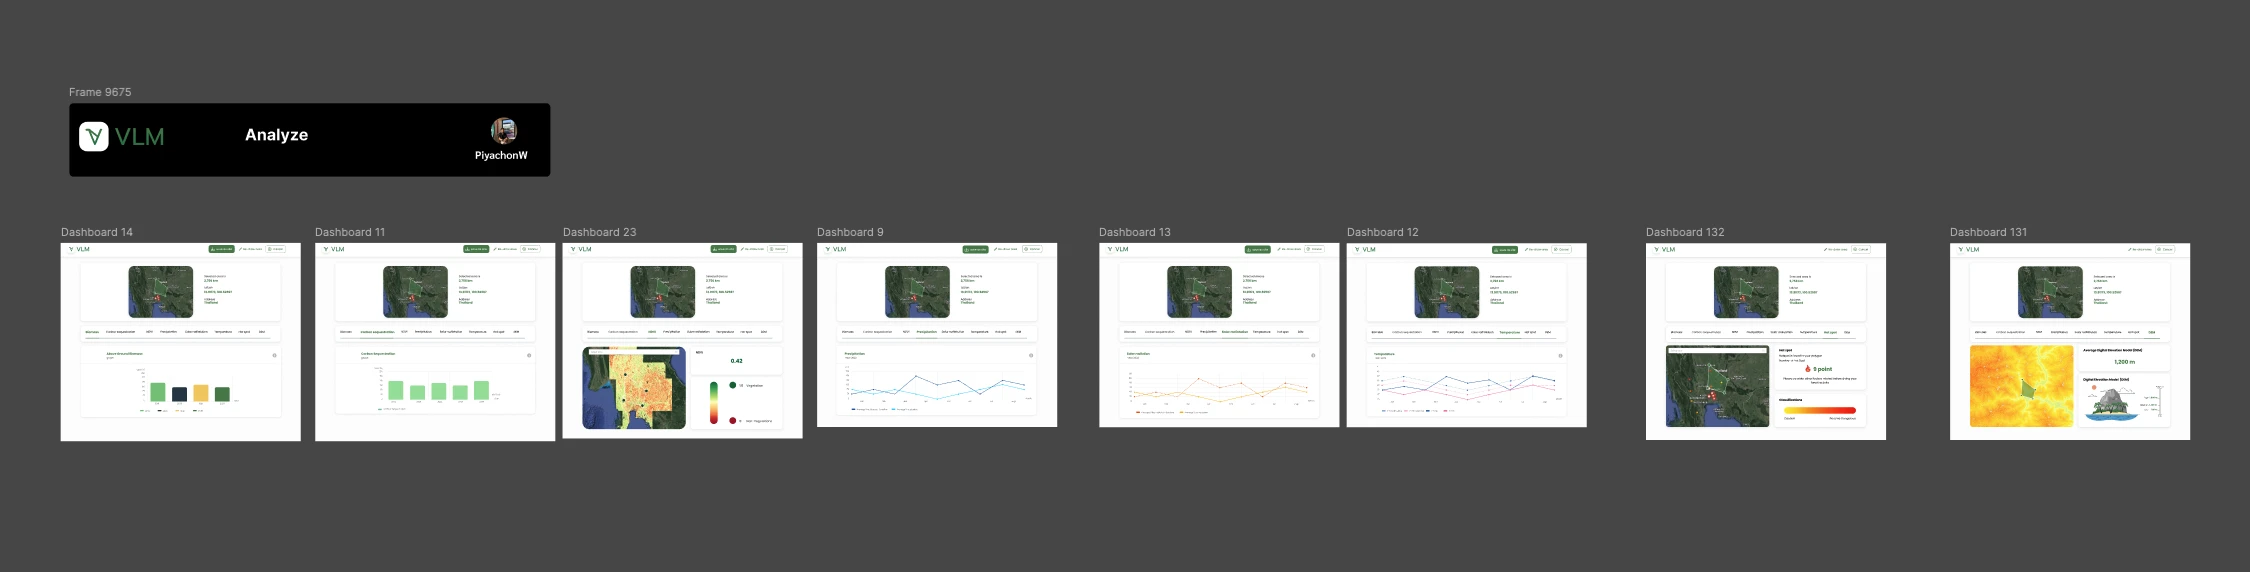
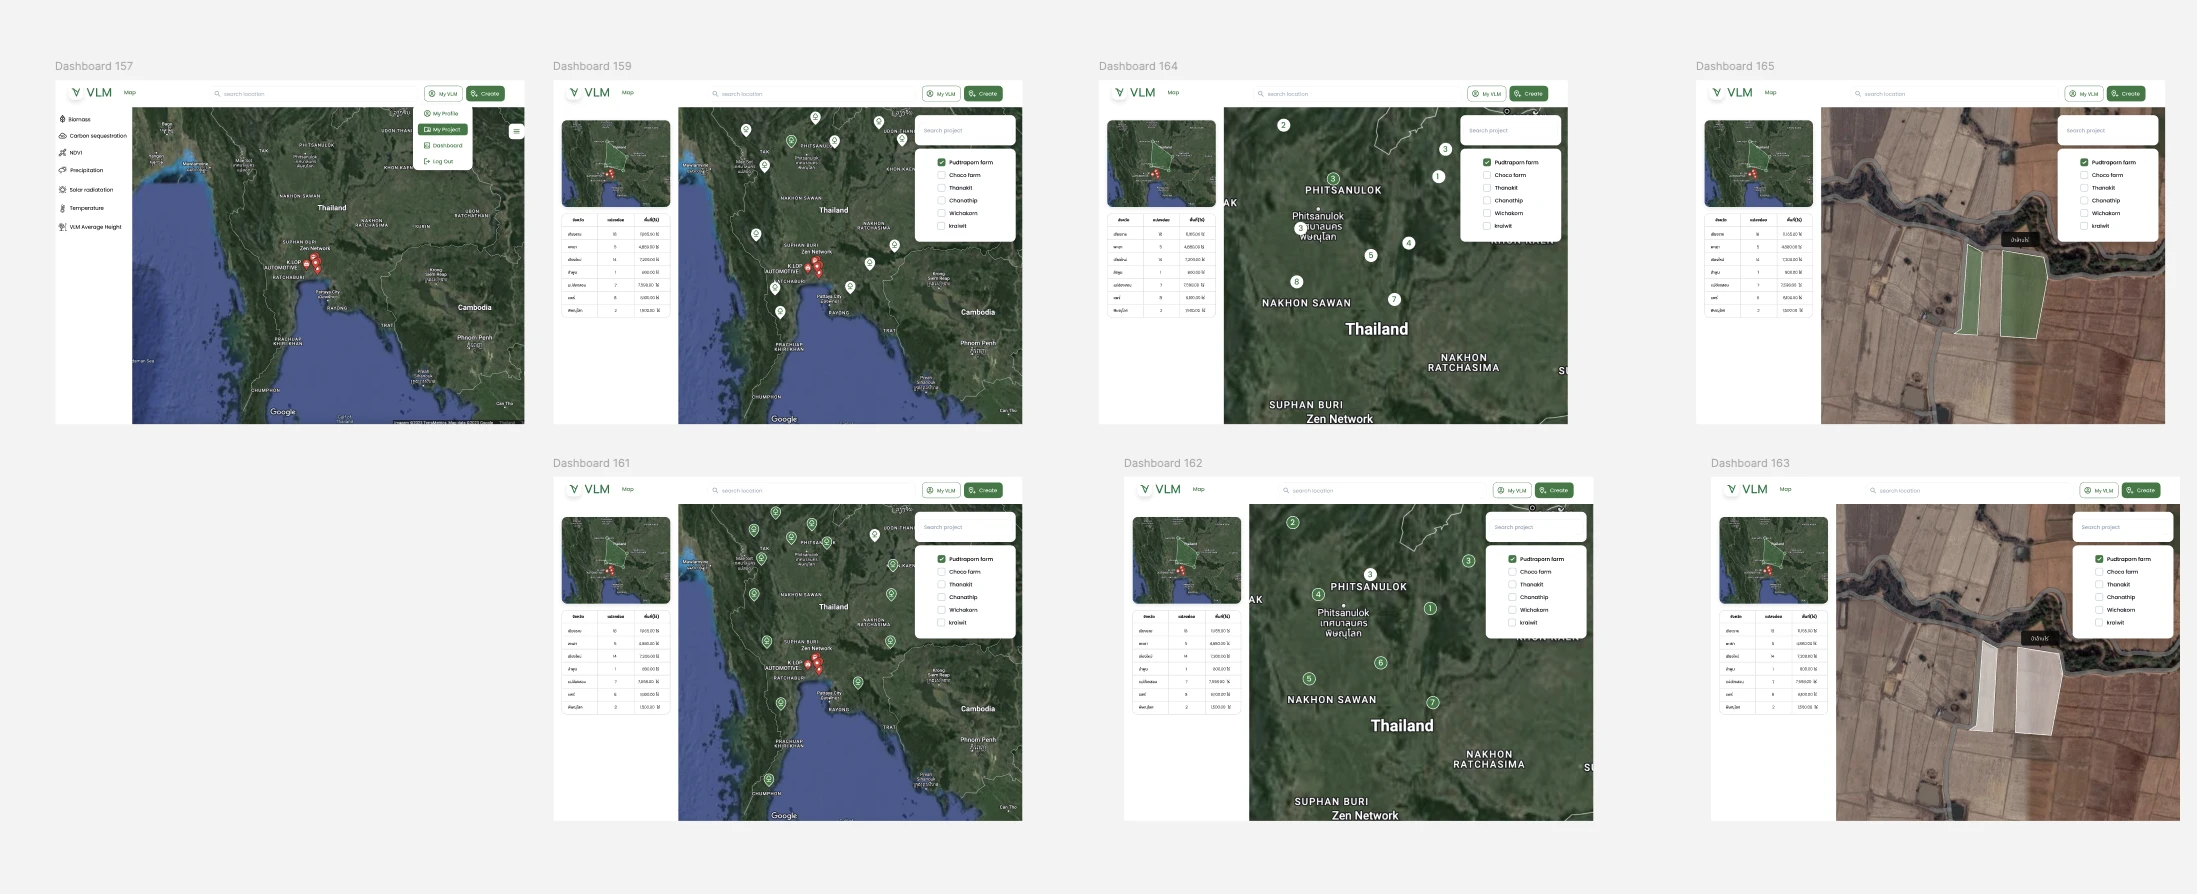
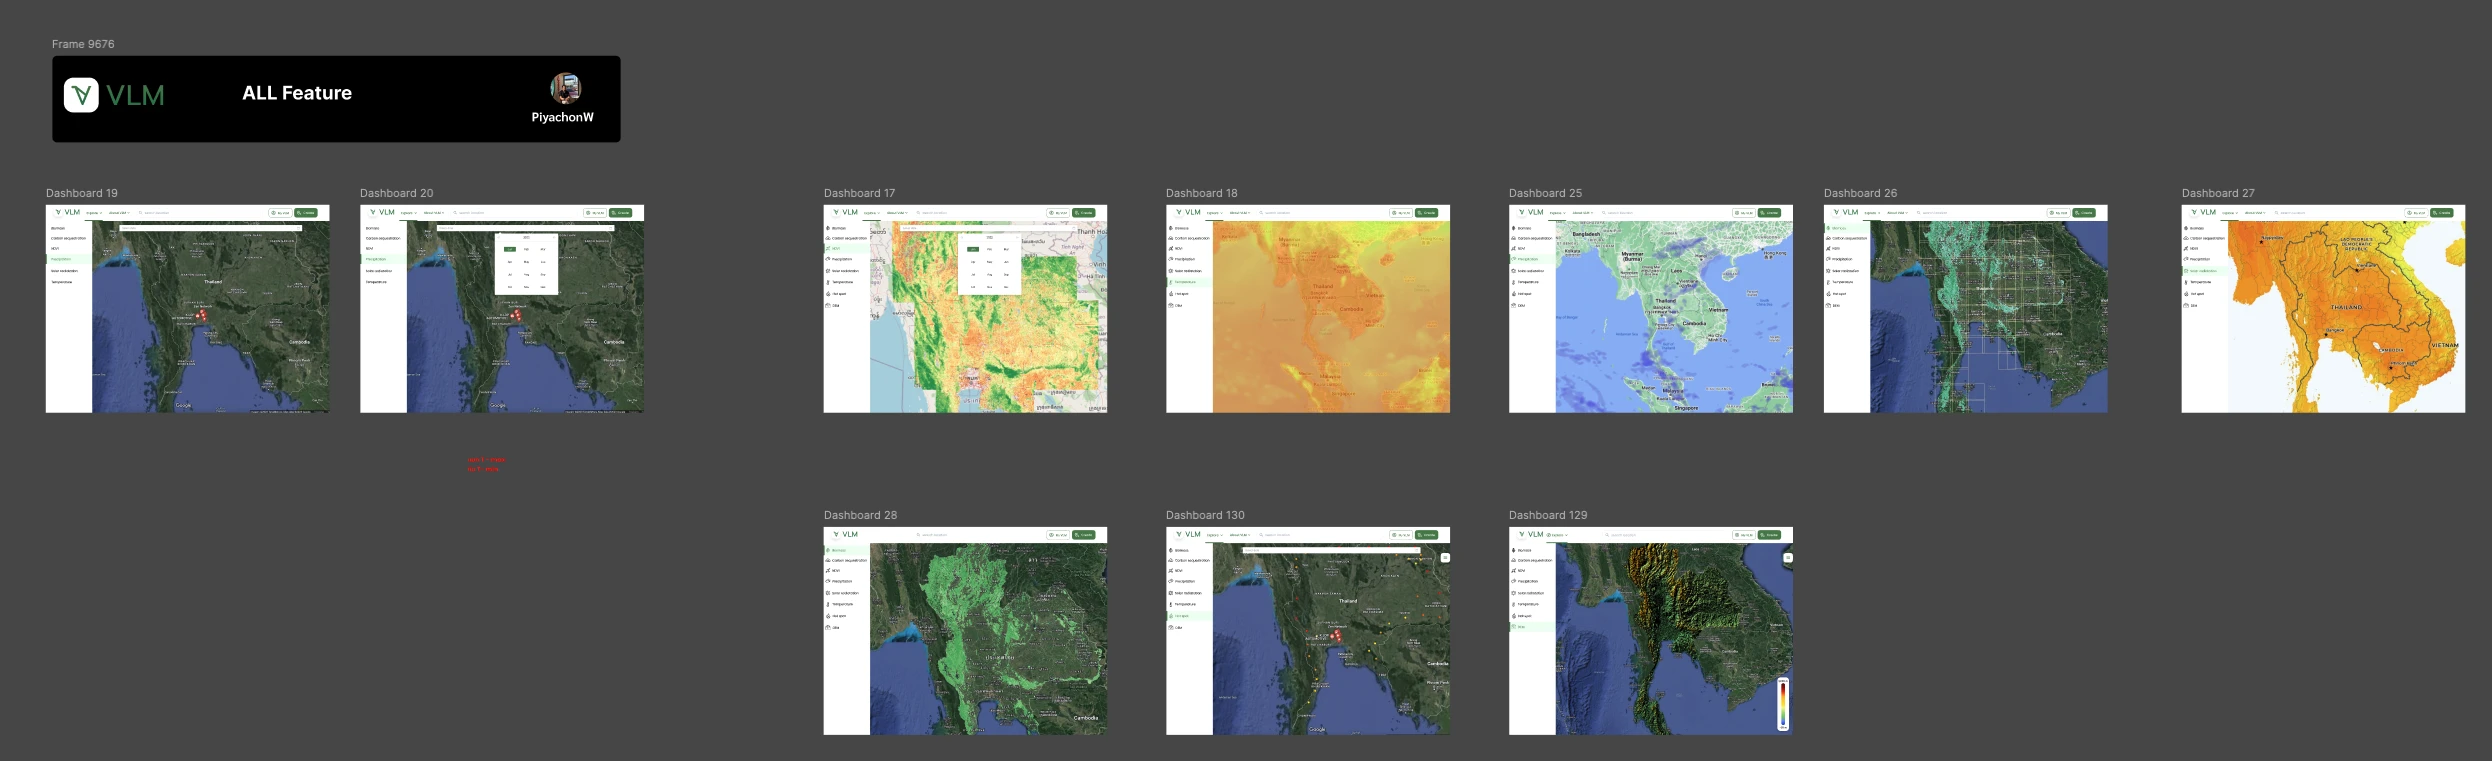
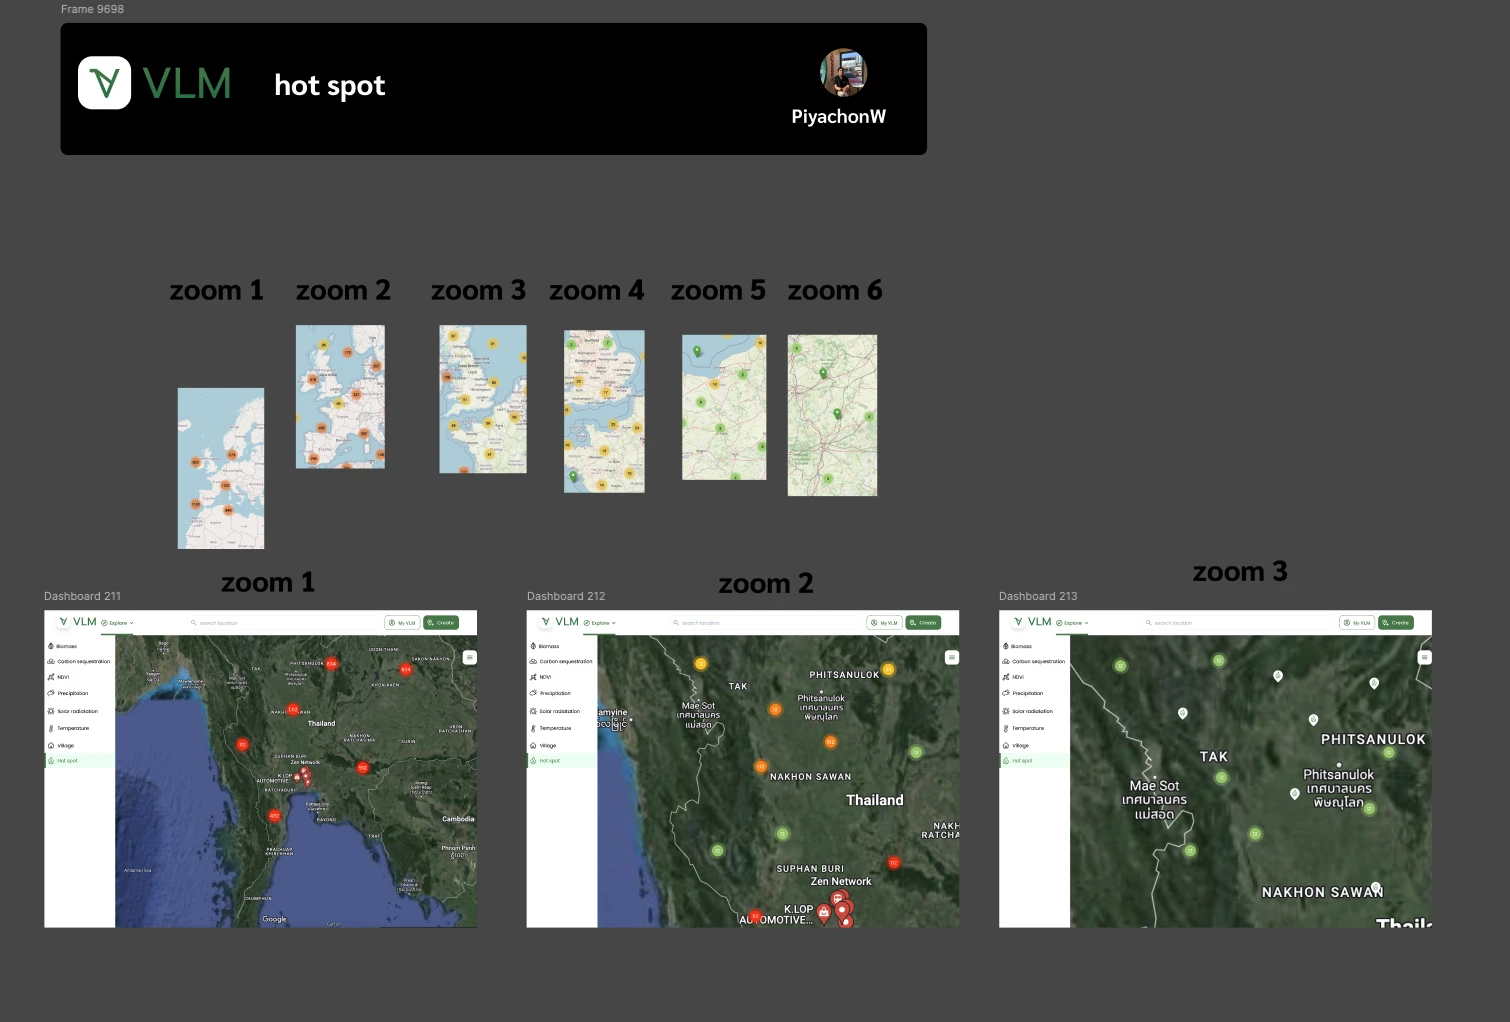
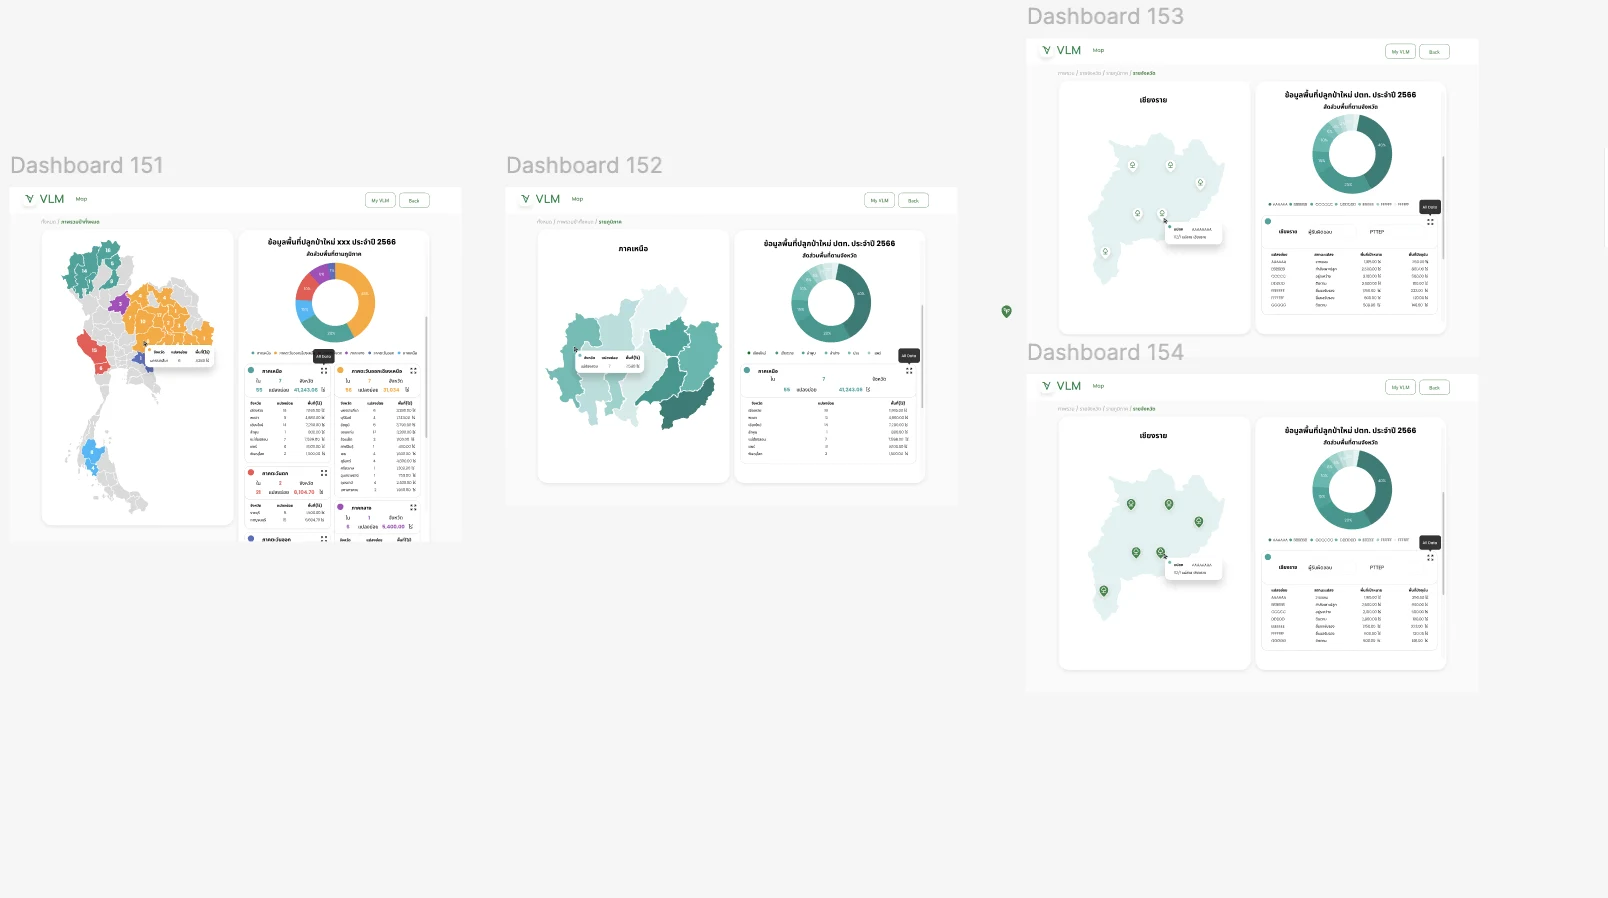
VLM Land Monitoring is a web platform that turns satellite data into plot-level environmental analysis. The design covers the full path from defining an area, by drawing or uploading a polygon, through per-metric analysis and map layers, to project management and provincial reporting.
Problem & Baseline
Satellite and environmental data comes in very different shapes: values compared across plots, time series, and colour-ramped rasters. Showing them all in one visual language makes each harder to read, and stacking layers on a map can hide the base map users rely on for orientation. Users also needed to define the area they care about, keep track of plots across several projects, and turn the results into reports that hold up outside the interface.
Key Design Decisions
Outcomes
| Area | Before | After | Outcome |
|---|---|---|---|
| Area definition | Analysis needed a clearly defined plot | Draw or upload a polygon, with size feedback and limits | Clearer |
| Metric reading | Different data shapes in one visual language | A chart treatment matched to each metric | Easier to read |
| Map layers | Overlays could hide the base map | Layers switched on one map with a readable base | More legible |
| Hot spots at scale | Markers could merge into one mass at country scale | Clustering defined across six zoom levels | Interpretable |
| Reporting | Results needed to hold up outside the interface | Province-level tables and charts built for export | Report-ready |
What I Learned
Different data shapes need different chart treatments; forcing one visual language onto every metric made each of them harder to read.
On a layered map, the base map is part of the information. Overlays had to be designed so users never lost their orientation.
Zoom behaviour is a design decision: without a clustering rule, the same hot spot data is readable at one scale and meaningless at another.